第一部分:审题明意
Table :You should spend about 20 minutes on this task.Write at least 150 words.
The table below gives information on consumer spending on different items in five different countries in 2002.
Summarise the information by selecting and reporting the main features, and make comparisons where relevant.

第二部分:Task 1结构讲解
Part 1: 三个要素
研究对象
数据类型: The number/amount of … The percentage/proportion of…
时间范围: between … and ….; from …to…

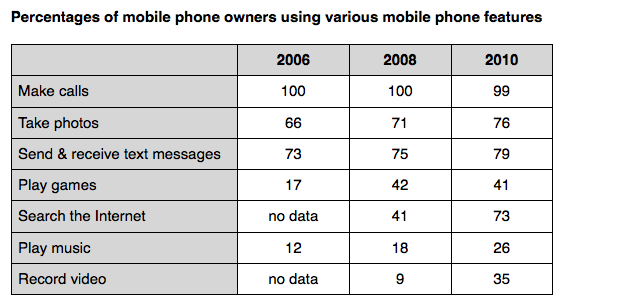
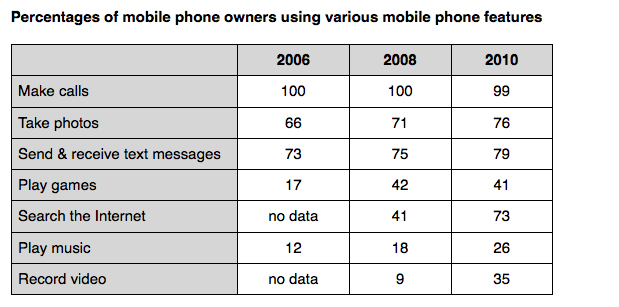
举个栗子: The table compares the percentages of people using different functions of their mobile phones between 2006 and 2010.
Part 2:两大任务:
Main features: Top, Bottom, Turning Point, Exception…
Make comparisons: 排序,倍数,计算,分组,省略…
举个栗子:
排序:Of the three companies, A has the highest sales figure, followed by B and C.
Of the three companies, A comes top of the list in terms of sales figure, and B is the second highest.
倍数: A is three times higher than B.
A is four times as high as B.
省略: Range from…to…
Part 3: 首要特征,总体趋势

Throughout the period shown, the main reason why people used their mobile phones was to make calls. However, there was a marked increase in the popularity of other mobile phone features, particularly the Internet search feature.
